cs-02
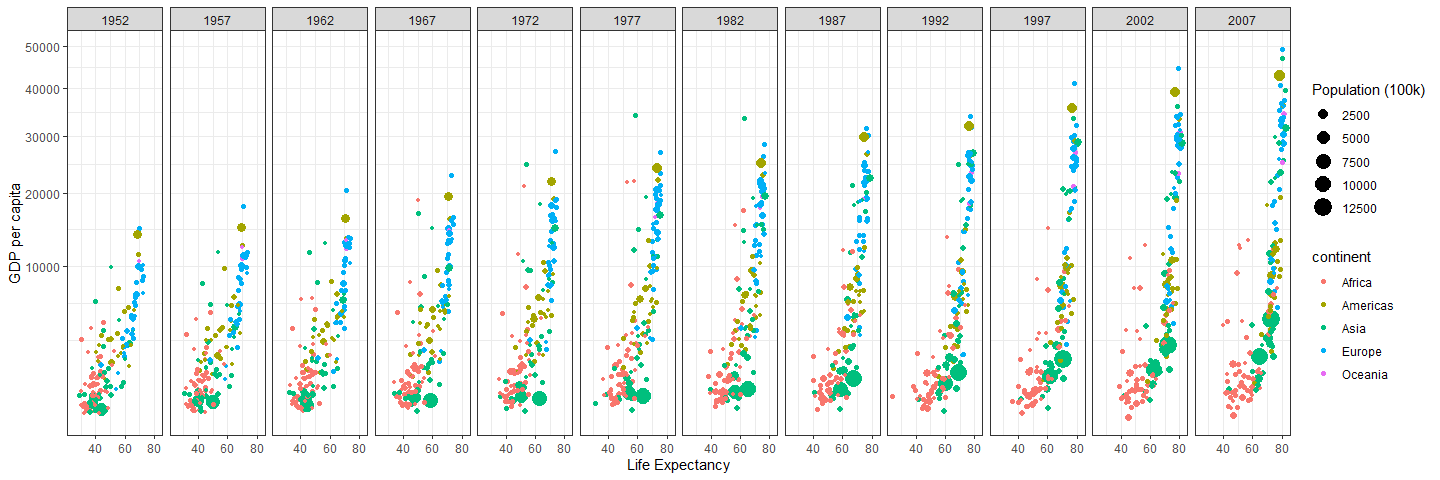
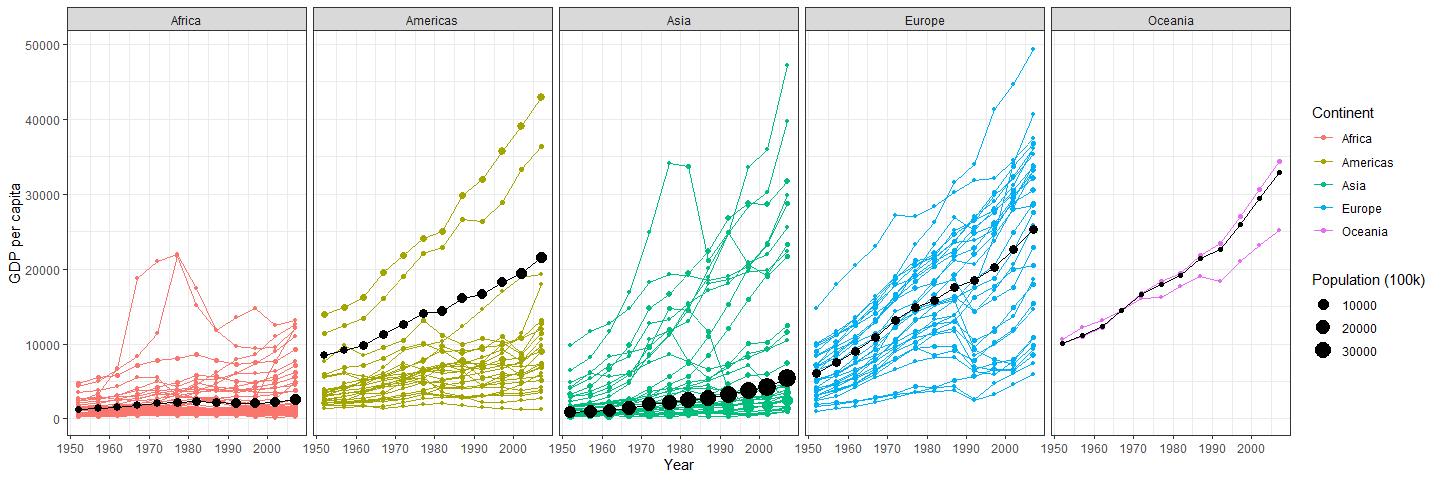
Case Study 2: Wealth and Life Expectancy (Gapminder)
Background
Hans Rosling is one of the most popular data scientists on the web. His original TED talk was very popular among my friends when it came out. We are going to create some graphics using his formatted data as our weekly case study. Note that we need to remove Kuwait from the data (discussion on this)
Reading
This reading will help you complete the tasks below.
Tasks
Plots