DataThink Development
  • Modules
  • R Help
  • Resources
    • Course Textbook
    • R for Data Science
    • Git/GitHub and R
    • R Markdown: The Definitive Guide
    • Geocomputation with R

    • Supplemental Material
    • Happy Git and Github for the useR
    • plotly for R
    • Computing in R for Social Sciences
    • Statistical Concepts in Presenting Data:
    • Advanced R
    • R Packages
    • Tidy evaluation
    • Fundamentals of Data Visualization
    • Geocomputation with R
    • Crosstalk: htmlwidgets add-on

On this page

  • Task 19: Spatial Data and Measure Data
    • Background
    • Reading
    • Tasks
  • Image

task-19

Task 19: Spatial Data and Measure Data

Background

Up to this point, we have dealt with data that fits into the tidy format without much effort. Spatial data has many complicating factors that have made handling spatial data in R complicated. Big strides are being made to make spatial data tidy in R. However; we are in the middle of the transition.

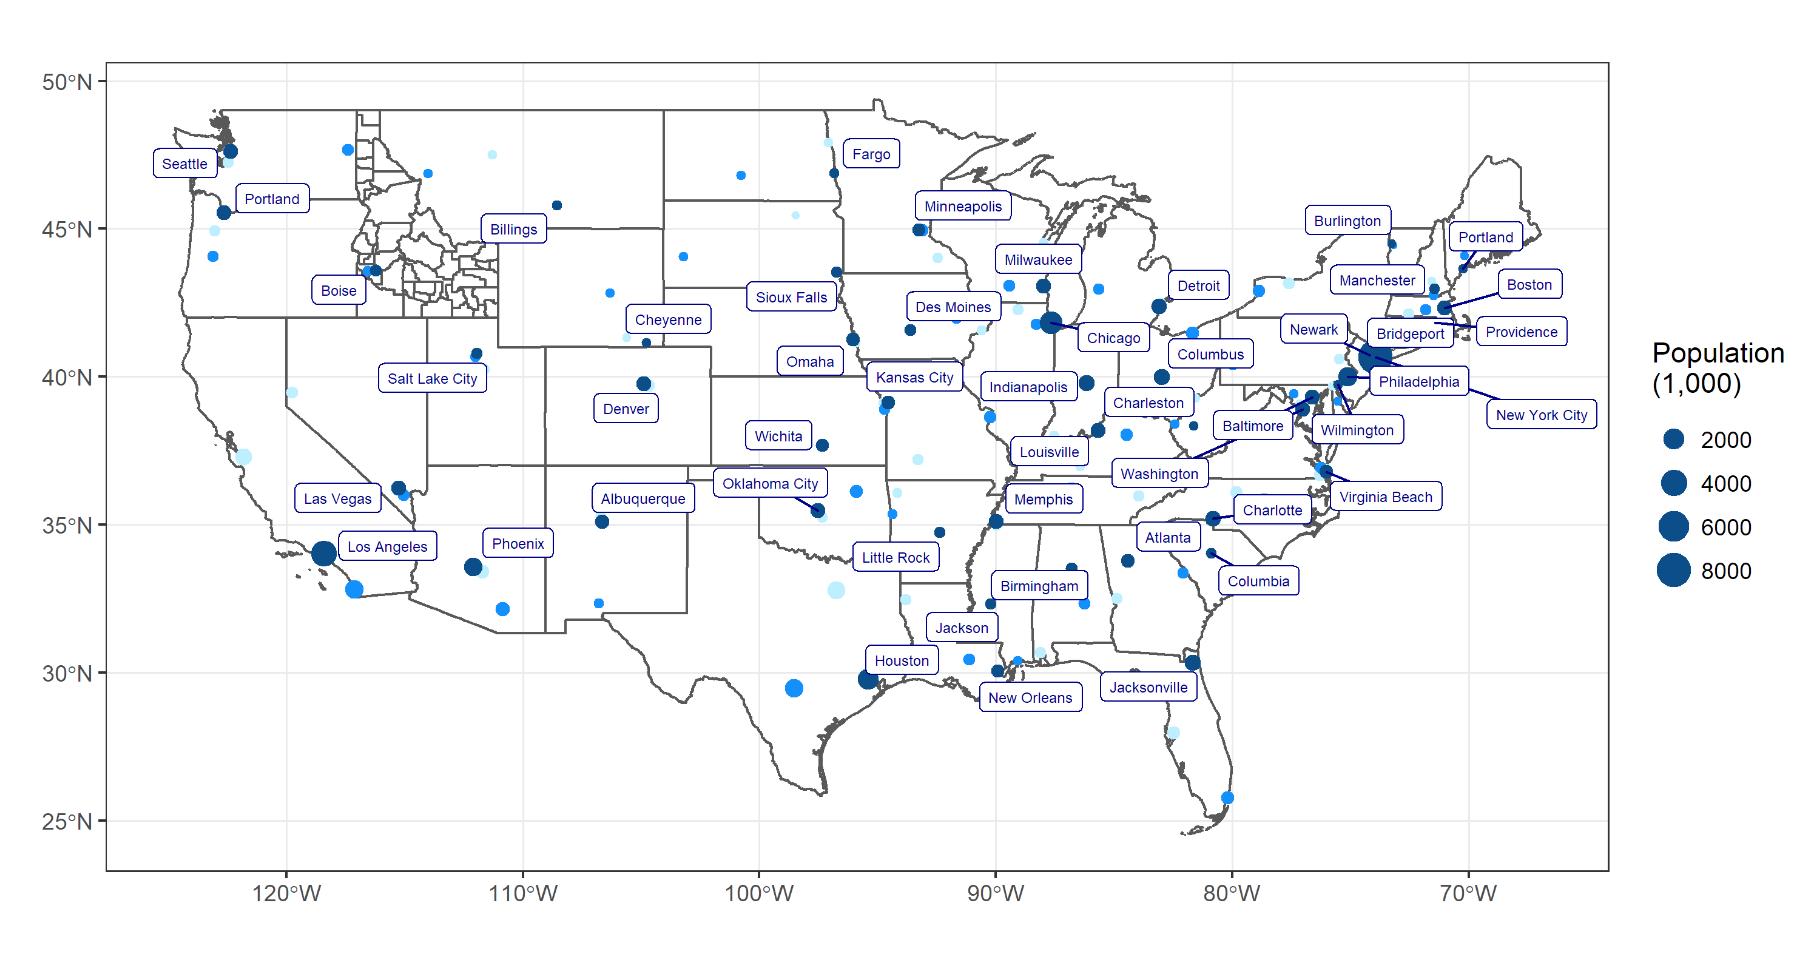
We will use library(USAboundaries), library(ggrepel), and library(sf) to make a map of the US and show the top 3 largest cities in each state. Specifically, you will use library(ggplot2) and the function geom_sf() to recreate the provided image.

Reading

This reading will help you complete the tasks below.

  • o Using SF package with tidyverse
  • o SF R package
  • o USAboundaries R Package
  • o Video on spatial datums
  • o Video 2 on spatial datums

Tasks

Image