DataThink Development
  • Modules
  • R Help
  • Resources
    • Course Textbook
    • R for Data Science
    • Git/GitHub and R
    • R Markdown: The Definitive Guide
    • Geocomputation with R

    • Supplemental Material
    • Happy Git and Github for the useR
    • plotly for R
    • Computing in R for Social Sciences
    • Statistical Concepts in Presenting Data:
    • Advanced R
    • R Packages
    • Tidy evaluation
    • Fundamentals of Data Visualization
    • Geocomputation with R
    • Crosstalk: htmlwidgets add-on

On this page

  • Task 2: Wax On, Wax off
    • Background
    • Reading
    • Tasks

task-02

Task 2: Wax On, Wax off

Background

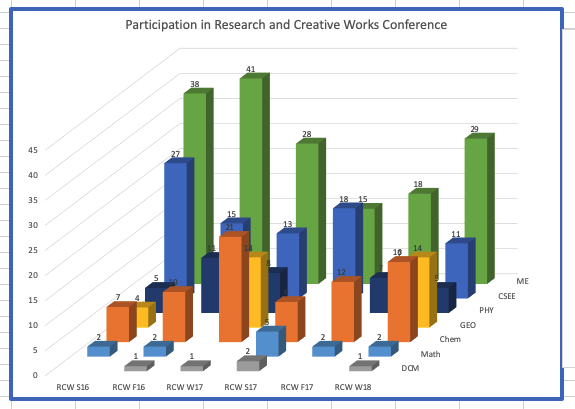
This task is intended to get all of us on the same page in R. You will copy code from your readings and then improve the Research and Creative Works conference visulization from this Excel file. Even if you have used R before, this will be an excellent refresher. If you do not get the title of this task, watch this.

  • Course Website

Reading

This reading will help you complete the tasks below.

  • o Chapter 4: R for Data Scientists - Workflow Basics
  • o Modern Drive: Chapter 1 Getting Started with Data in R
  • o Using the geom_col function
  • o Using the geom_line function

Tasks


library(tidyverse)
dat <- read_csv("https://byuistats.github.io/M335/data/rcw.csv", 
                col_types = cols(Semester_Date = col_date(format = "%m/%d/%y"), Semester = col_factor(levels = c("Winter", "Spring", "Fall"))))